Weightage: 4 – 5 marks

Get Download Link on your Phone
India’s Most Loved Science & Maths Videos – Packed in a Mobile App!
Introducing Avanti Gurukul App
Concepts covered:
- Basic terms related to grouped frequency distribution
- Mean, Mode and Median of grouped data
- Empirical relationship between central tendencies
- Ogives
Expected questions:
- Questions based on finding out mean, median and mode of grouped frequency are asked for 3 marks
- Questions based on drawing ogives of given data and thereafter finding median using the ogives are asked in 4 marks.
Synopsis:
- Basic terms related to grouped frequency distribution: Lets look at the basic terms using an example:
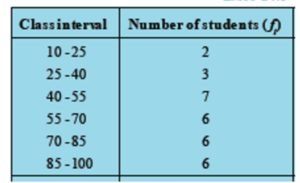
Class Interval – large data are condensed into groups. These groups are called classes or class intervals. Over here, class intervals are: 10-25, 25-40, 40-55 and so on
Frequency – Number of times a data occurs is called its frequency. For example, over here, 7 students have their marks between 40-55. Therefore, 7 is the frequency of the class.
Lower & Upper class limit – In each of these classes, the least number is called the lower class limit and the greatest number is called the upper class limit.
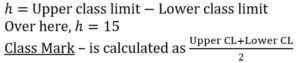
Class size – The size of a class is called class size or class width
It is represented by h and calculated as
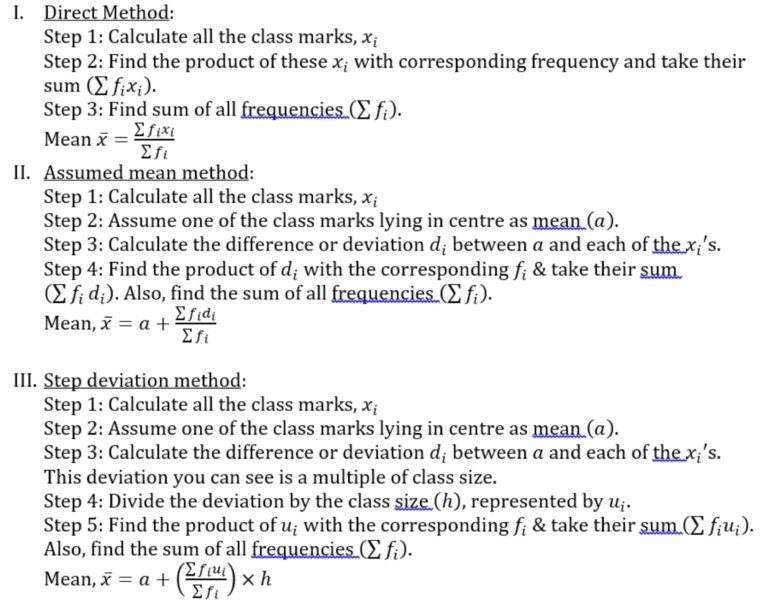
While calculating the mean of a grouped data, we assume that the frequencies of the class are centred around class mark and take this as the representative of the entire class.
- Mean, Mode and Median of grouped data:
Things to keep in mind:
- Class size of all class intervals should be equal
- Classes should always be continuous. If they are not, first make them continuous before solving the question.
- Mean: The mean of grouped data can be calculated in 3 different methods:
- Direct Method
- Assumed mean method
- Step deviation method
All the methods will yield the same result:
Empirical relationship between central tendencies
There is an empirical relationship which exists between these 3 central tendencies (mean, median and mode) and given as: 3Median= Mode + 2Mean
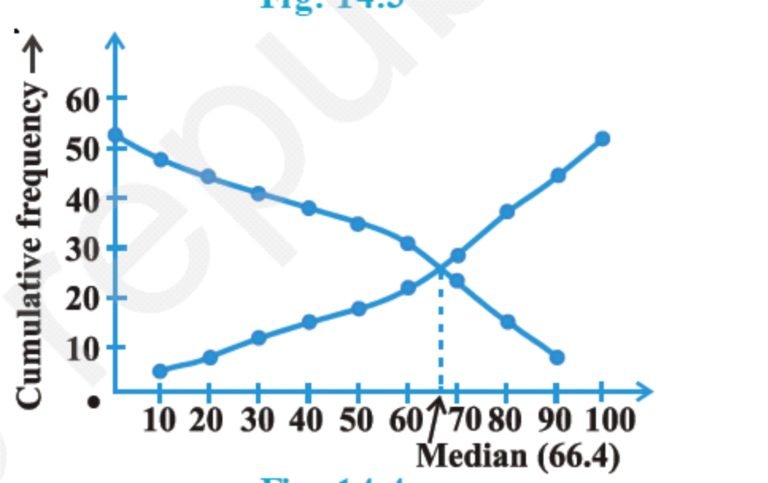
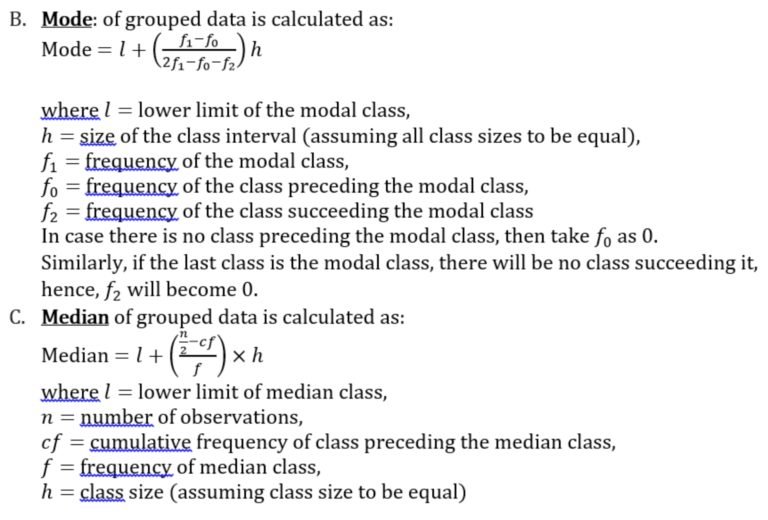
Ogives
They can either be of ‘Less than’ type which is an upward curve and looks like this:
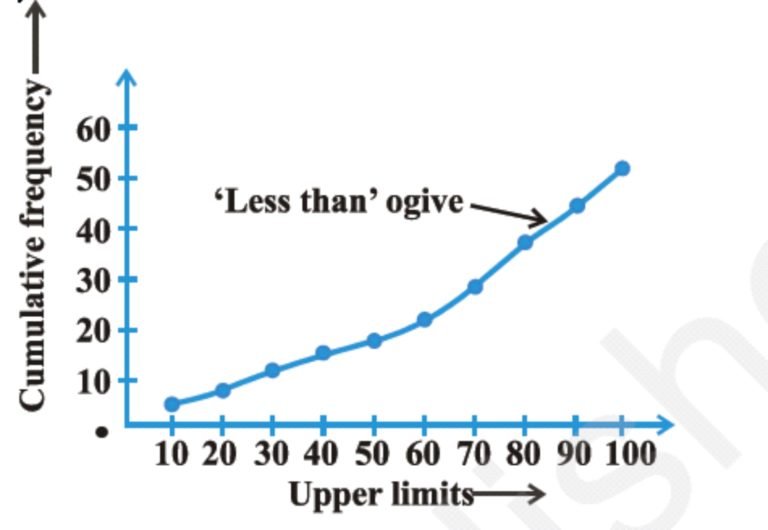
Or ‘more than’ type which is a downward curve and will look something like this:
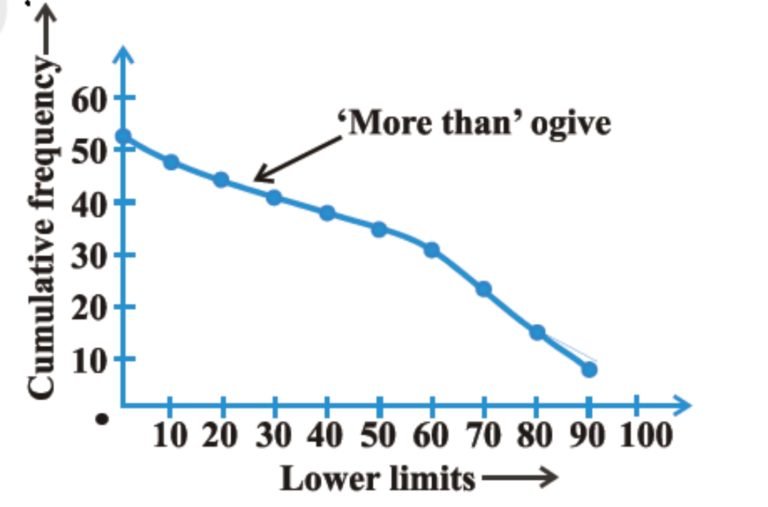
For finding median from ogive locate on the – axis. From this point, draw a line parallel to – axis cutting the curve at a point. The -coordinate of this point of intersection gives the median of the given observation.
When both less than & more than are drawn on the same graph, then, we can note that the -coordinate of point of intersection gives the median of the given observation.